The Bartlett, Healthy Streets and Tranquil City Collaborate to Map the Health of London’s Streets
28 January 2021
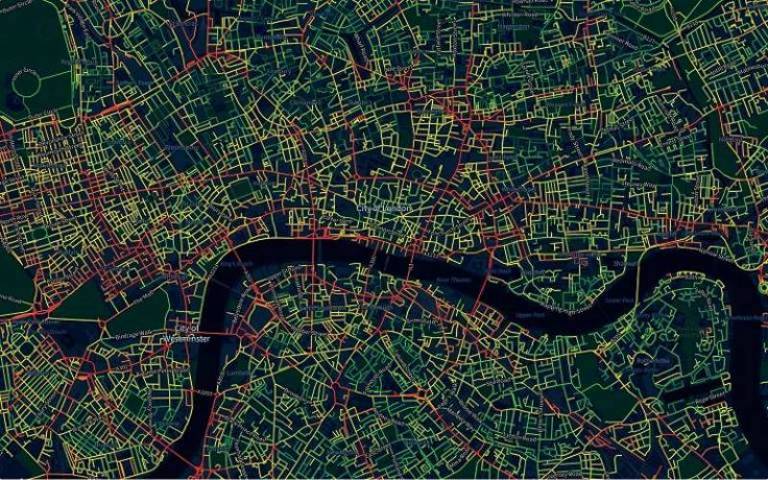
A dataset and interactive map – the Healthy Streets Index – rates every street in the city, using data that represents factors known to have the biggest impacts on our health and wellbeing.

Healthy Streets is a set of 10 evidence-based aspects of the human experience of being on streets, and was developed by Lucy Saunders, director of Healthy Streets, through her research into the ways that cities, towns and street environments impact on our health and wellbeing. The Healthy Streets Indicators describe the important factors for ensuring streets are healthy, welcoming and accessible for all people to walk, cycle and spend time on. Factors including air and noise pollution, street design – such as pavement space – traffic dominance, walkability – including neighbourhood connectivity and access to services and public transport - and trees are all incorporated into the dataset.
“Our understanding of the importance of our environments to physical and mental wellbeing has come to the fore as we have spent more time at home and in our local areas during the COVID-19 lockdowns and restrictions. The Healthy Streets Index uniquely offers a data led view of the physical and experiential quality of our environments. This enables us to make informed decisions about where we want to live, the routes we take on everyday journeys and where improvements are needed to ensure everyone can live in the healthiest environments possible.”
- Dr Ashley Dhanani - The Bartlett School of Architecture
Current lockdown and social distancing rules mean that many Londoners already actively plan daily routes for walking and cycling. The Index supports this as well as providing useful information for those who want to avoid busy and noisy roads, including parents of young children, older residents, asthma suffers and those sensitive to loud noise.
People looking to move home can also use the map to find preferably neighbourhoods, while city planners and developers can use the data to improve equity and liveability across London.
The map shows that living in a lower socio-economic area doesn’t necessarily mean living on an unhealthy street, with streets in the boroughs of Lambeth, Redbridge and Newham featuring in the top 5% and streets including Park Lane and Brompton Road featuring in the bottom 5%.
The data also reveals large variations between boroughs. In Camden one in six streets are in the top 5% of healthiest streets, whilst this is only one in 500 in Bexley. Hillingdon has the highest proportion of the least healthy streets, with one in 14 among the bottom 5%, whilst Islington has one in 25 of its streets in the bottom category.
“Our citywide approach can enable insightful comparisons across different neighbourhoods and provide a better understanding of the kind of city we want to design, make and live in. The less polluted, more people-friendly and liveable streets earn higher Healthy Streets scores reflecting the enhanced human experience of healthier street environments.”
- Nicolas Palominos - urban design researcher, UCL Centre for Advanced Spatial Analysis.
The datasets selected for inclusion in the Index include the most accurate measures of noise and air pollution, and a dataset showing the available pavement space, which is critical to streets being healthy, accessible and welcoming, particularly as Londoners seek to socially distance. Tree canopy cover and access to services, amenities and public transport are also incorporated.
The Healthy Streets Index combines the best available data to reflect its 10 Healthy Streets Indicators at a regional scale. Healthy Streets has been adopted by the Mayor of London as the framework for transport and street planning. It is the framework for the Mayor’s Transport Strategy, a core policy of the London Plan and integrated into all of his statutory strategies.
More information
Image: The Healthy Streets Index
 Close
Close

