New infographics from our Shipping Team highlight how carbon emissions could be cut by 2050
25 June 2019
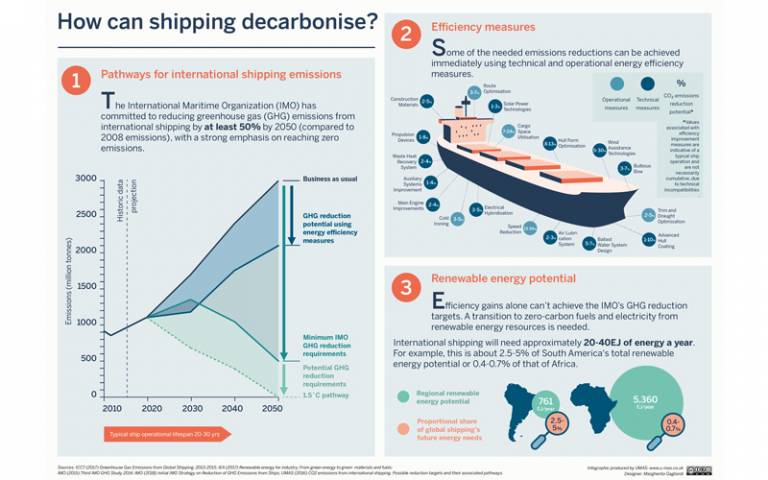
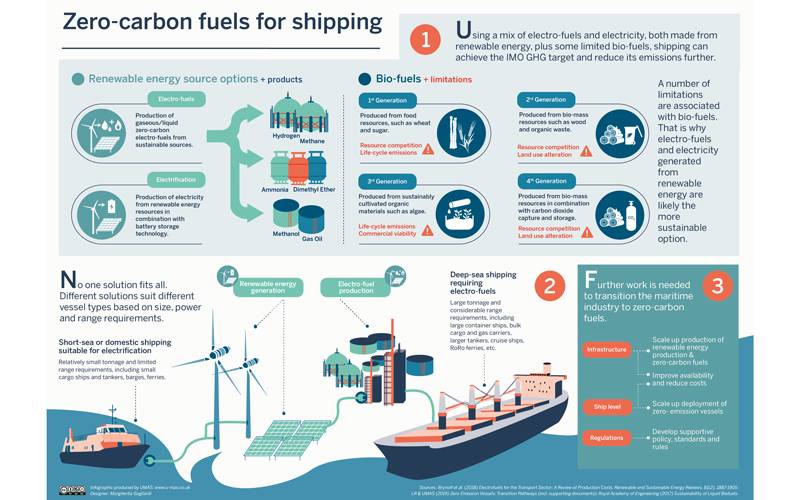
A pair of new infographics were released by UMAS (a joint venture between UCL Energy's Shipping Team and MATRANS) on 25 June 2019 showing what fuels will help decarbonise the global shipping industry by 2050.

In April 2018, the shipping industry committed to a sector-wide GHG target of reducing emissions by ‘at least’ 50% by 2050. Achieving this target will require a combination of short-, mid- and long-term policy measures that enable the sector to reduce its carbon intensity and switch to zero-carbon fuels and zero emission vessels (ZEVs), which need to enter the fleet as early as 2030.
Our new infographics show the deep emission cuts that will be needed to meet the IMO GHG targets and demonstrate that energy-efficiency measures, while important, will not be sufficient on their own. It also highlights the huge potential of untapped renewable energy potential to produce low- or zero-emissions electro-fuels, and what next steps are necessary to scale-up these solutions.
The infographic builds on findings from nearly ten years of research, such as Low Carbon Shipping & Shipping in Changing Climates projects and collaboration with Lloyd’s Register on Zero Emission Vessels (How do we get there and Transition Pathways).
Isabelle Rojon, Consultant at UMAS, says “In order to achieve the IMO’s GHG emission targets and align the shipping industry with the Paris Agreement temperature goals, shipping will need to move away from fossil fuels and switch to zero-carbon fuels as soon as possible. We hope the infographics will give interested stakeholders an overview of what this deep transition entails and which steps to take next to get it underway.”
Colin Robertshaw, Doctoral Researcher at UCL Energy Institute, says “Through consideration of the respective production processes, the potential exists to expand the range of alternative fuels that may be considered compatible with decarbonisation of the maritime industry. In this way, a number of alternatives that would otherwise be discounted, due to their emission characteristics as fossil-fuels, may be reconsidered in the form of biomass and renewable energy derived variants (i.e. bio- and electro-fuels).”
Dr Nishatabbas Rehmatulla, Principal Consultant at UMAS, says “Shipping will have to at least halve its emissions by 2050 and completely decarbonise under the 1.5 degrees temperature goal. We must not lose sight of this important long-term goal, which requires action now. The infographic summarises, and is underpinned by, almost a decade of research, and suggests next steps to navigating decarbonisation in the sector"
The infographics are released under CC-BY-NC-ND license so that they can be shared widely and reused in presentations with attribution to UMAS.

Downloads
More information
- Stay up-to-date on the emissions agenda: sign up to the UMAS newsletter for the latest research, publications, news and events from UMAS
- Find out more about UCL Energy's Shipping Team
- Visit the UMAS website
- Visit lowcarbonshipping.co.uk
About UMAS
UMAS is a sector-focused commercial advisory service that draws upon the world-leading shipping expertise of the UCL Energy Institute, combined with the advisory and management system expertise of MATRANS. In combination, UCLC, UCL Energy Institute, and MATRANS operate under the branding of the entity UMAS. For more details visit www.u-mas.co.uk
UMAS undertakes research using models of the shipping system, shipping big data (including satellite Automatic Identification System data), and qualitative and social science analysis of the policy and commercial structure of the shipping system. Research and consultancy is centred on understanding patterns of energy demand in shipping and how this knowledge can be applied to help shipping transition to a low-carbon future. UMAS is world-leading on two key areas; using big data to understand trends and drivers of shipping energy demand or emissions and using models to explore what-ifs for future markets and policies.
Top image: infographic 1; lower image: infographic 2
 Close
Close

