Windstorms
Research on windstorms is undertaken by UCLHC partners Tropical Storm Risk and EuroTempest.
Researcher: David Smart
The United Kingdom and Western Europe are located at the eastern end of the North Atlantic storm track. During the winter months cyclonic storms, extra-tropical cyclones, frequently under go rapid intensification in the eastern Atlantic ocean basin (a process known as ‘explosive cyclogenesis’) - such storms are called ‘bomb cyclones’ or just ‘bombs’. In the late summer or autumn tropical storms maturing in the western Atlantic can also mutate into extra-tropical storms which can also undergo explosive cyclogenesis. When they make landfall during their intensification or maturing phase these types of cyclonic storms are known generically as ‘Windstorms’.
Cyclonic windstorms can be a major hazard to shipping on the high seas and maritime facilities nearer land, however their greatest impact occurs when the strongest winds occur over land. Strong sustained winds and wind gusts (which have the greater impact despite their relatively brief duration) are a major hazard to infrastructure, property and life. For instance the ‘Great October Storm’ of 1987 caused extensive damage and disruption across NW France, southern England and Norway with UK insurance losses exceeding £1.4 billion, the loss of 15 million trees, power and telephone disconnections to hundreds of thousands of households and at least 22 fatalities (ABI, 2003).
Therefore, understanding how these storms form, their climatological frequency, the origin of the strongest winds and their predictability are of great concern to scientific researchers, weather forecasters and the insurance and re-insurance industries. Although great advances have been made in Numerical Weather Prediction (NWP) and computer modelling of severe storms in the past 30 years more remains to be understood about the origin and nature of the extreme winds. Heavy rain and snowfall, causing flooding, and occasionally severe icing are additional hazards.
At UHC we have a facility for high-resolution modelling of weather systems both in real-time and for historical cases. It is based on the Weather Research and Forecasting (WRF) model developed by NCAR (National Center for Atmospheric Research) in the United States.
Our version of the model has been continuously up-graded and modified. In recent years we have focussed on assessing the capability of the model, its strengths and weaknesses, when simulating windstorms at moderate to high-resolution (horizontal grid spacings of 15-5 km).
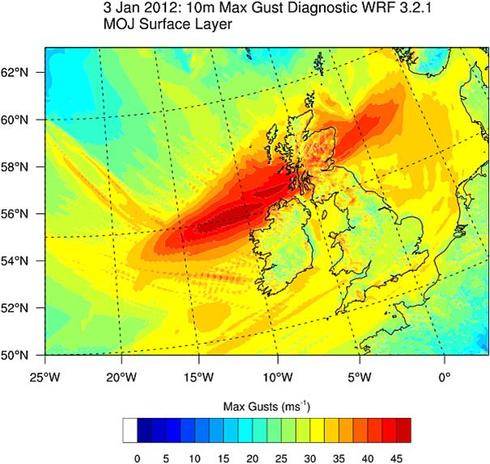
A paper now in press at the Quarterly Journal of the Royal Meteorological Society (Smart and Browning, 2013) details results for a windstorm (Windstorm ‘Ulli’) which affected northern Ireland and central-southern Scotland in early January 2012. In particular we address the question of how the strongest observed wind gusts arose and how differing configurations of the model simulate these extreme winds. Figure 1 shows the model wind gust footprint for one such simulation. Emeritus Professor Keith Browning (Reading University), collaborator on the paper, has proposed that the strongest winds in the October 1987 storm were due to a phenomenon he called a ‘sting jet’ and that the most extreme winds in windstorms were due to this effect. Sting jets are thought to occur when evaporation of ice clouds at the tip of the cyclonically curved cloud head hook (as observed in satellite imagery) causes air aloft to cool and accelerate towards the earth’s surface. When conditions are suitable this high-momentum air can be mixed down to produce strong wind gusts. Although recent research work has focussed on sting jets their exact origin and nature remains a matter of debate and controversy. This, as well as being a matter of scientific curiosity, is of great practical importance as it is known that wind gusts incur the greatest damage and small increases in gust strength have a disproportionate impact on the magnitude of this damage.

Figure 1. Simulated maximum diagnosed surface wind gusts (m/s) for windstorm ‘Ulli’, 18 UTC 02 Jan to 12 UTC 3 Jan 2012.
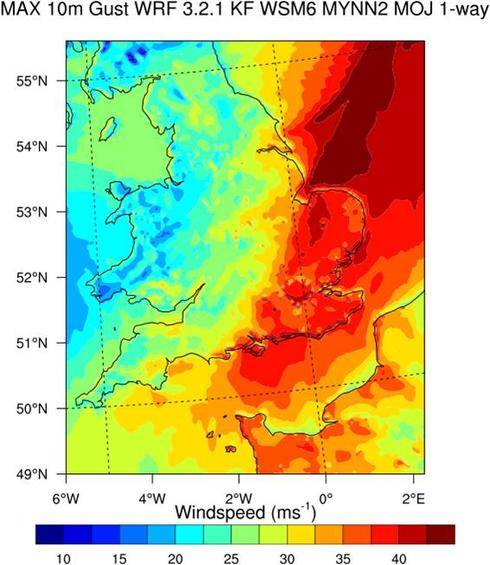
For Windstorm Ulli Smart and Browning (2013) find a surface sting jet in their simulations, but determine that it was likely not the cause of the strongest observed winds. Instead, these were due to a feature called the ‘Cold-Conveyor Belt Jet’- an intense low-level jet which develops around the bent-back frontal zone in this type of storm. The origin, nature and interaction of the different jets is the subject of on-going research. Great care was taken in the study to compare the model results with observations and to try to determine which specific model configuration performed best.
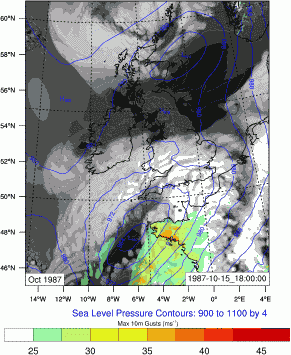
One of the aims of this work is that, having verified the model against a recent, well observed storm we can then apply it to studies of historical storms. For instance Figure 2 shows the wind gust footprint for the October 1987 storm simulated with a similar model configuration to that used in Smart and Browning (2013). Gusts exceeding 45 m/s are produced over some areas of southern England, although winds are too weak over NW France (a known problem with this type of simulation in this case). The movie below shows simulated cloud tops and diagnosed wind gusts from the same simulation. Note how the strongest gusts over southern England form ahead of the curved cloud head consistent with the sting jet hypothesis. Indeed, detailed analysis of the model output confirms these gusts originate from a sting jet and this is consistent with previous studies using a different model.

Figure 2. Simulated maximum diagnosed surface wind gusts (m/s) for the October 1987 windstorm, 18 UTC 15 October to 12 UTC 16 October 1987.
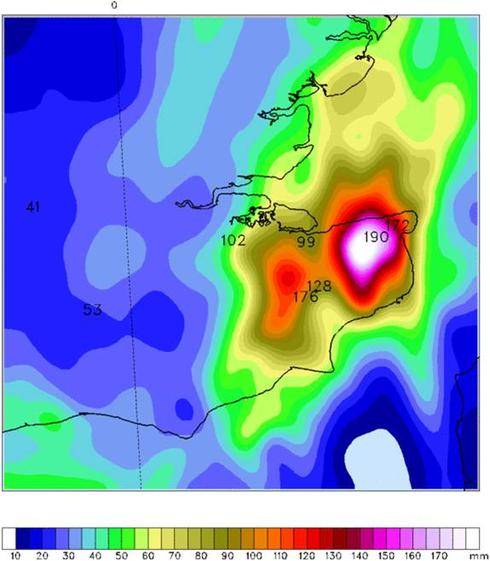
High-resolution simulation techniques of this type are not only applicable to windstorm cases. WRF has been used to simulate damaging winds along tornadic cold fronts (Smart and Browning, 2009) and work is on-going to apply it to examples of other tornadic storm systems in the UK. The techniques can be applied to recent and historical cases of large hail and heavy rainfall. Figure 3 shows the accumulated precipitation from a reanalysis simulation of an extreme rainfall event over Kent, SE England in September 1973, when over 180 mm fell in less than 12 hours. At present this event remains poorly documented and characterised in the literature. Coarse renalysis data was ‘down-scaled’ to very high-resolution (grid spacing 1.5km) with WRF.

Figure 3. Simulated accumulated precipitation (mm) to 18 UTC 21 September 1973 (shaded). Rain gauge observations (courtesy Jonathan Webb) are overlaid.
In a changing climate it is vital we place our understanding of recent weather events in the context of history and the climatological record. Validating our computer models against well-observed cases and applying them to understand the frequency and nature of historical events is a key area of research.
Video. WRF simulation of the October 1987 windstorm. Model cloud tops are depicted in grey-scale and diagnosed surface wind gusts shaded according to the colour scale.

 Close
Close


