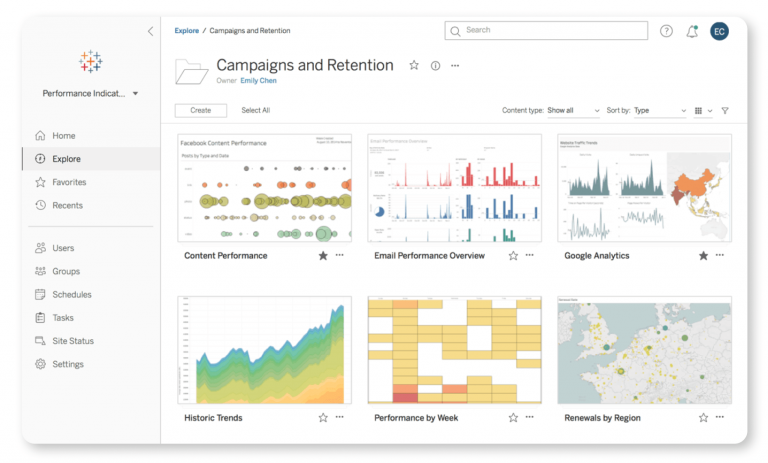
What is Tableau?
Tableau is a market-leading data visualisation and business intelligence tool used for reporting and analysing large amounts of data. At UCL, members of the Data & Insight team create Tableau dashboards to visualise strategic management information which colleagues can access via the UCL Tableau site (requires Tableau access). You can explore how Tableau works, how to interact with content, how to filter data and more on the Tableau support website (external resource). If you are new to Tableau, and only have time to watch one video, watch this one.

Accessing Dashboards
UCL's Tableau dashboards are accessible through the UCL Tableau Server (requires Tableau access). For an outline of what the available dashboards are, please see our catalogue of available Tableau dashboards. You can request access to the dashboards you require by following the link to MyServices on that page.
External training
If you want to explore using Tableau Desktop for developing and creating dashboards, our Tableau supplier is the Information Lab, who regularly host face-to-face training opportunities. There are also useful online training opportunities at LinkedIn Learning, and Tableau support has information on how to get started with a Desktop license.
Further Tableau support
If you'd like further support, find out more about the Date and Insight team and please contact us. A member of the Data & Insight team can visit your department to give a general overview of our dashboards, demo a specific product or provide focused training for you and your colleagues. Please get in touch to discuss your training needs with us.
For more information and FAQs, please see our full guide, Getting UCL Tableau Users Started.
 Close
Close

